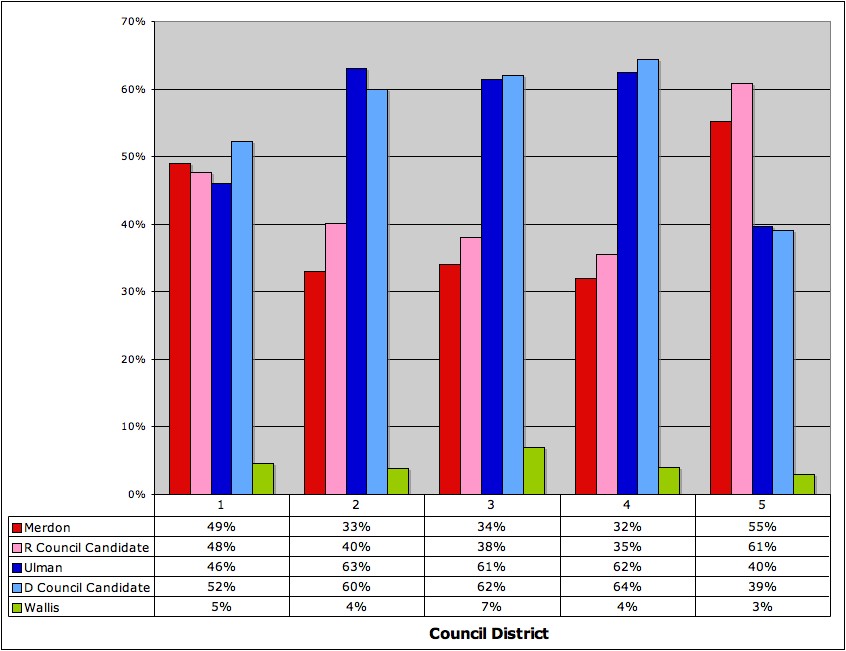
After starting with an overview yesterday, I’m going to dig a little deeper into the results of the County Executive (CE) race today in an effort to determine how much independent Steve Wallis affected the outcome. Since there’s no clear, objective way to do this, I used some creative measures that may take a little while to explain. Please bear with me.
As was shown graphically in yesterday’s post, both Ken Ulman and Chris Merdon failed to keep pace with candidates for county council from their party in most districts; Ulman bested Calvin Ball in District 2 and Don Dunn in District 5, while Merdon only outran one council candidate, Tony Salazar in District 1.
While such data are interesting, they don’t really tell us much about how the candidates performed relative to expectations or whether Wallis stole some of their votes. Indeed, in order to gauge whether Wallis had any impact at all, we have to first establish a baseline (how we think they would have performed without him). With the data I have, there’s no elegant way to do this. So, here’s my makeshift attempt, the methodology for which you are welcome to question or improve upon.
I established a new variable that called the Party Proxy Index. This variable estimates the expected performance of CE candidates by averaging the precinct-level voting percentages for the County Council, Governor and U.S. Senate candidates from within their respective parties (I used percentages to account for differences in total number of votes).
So, for instance, if Bob Ehrlich received 55 percent of the votes in a given precinct, Michael Steele received, and Tony Salazar received 45, the average/expected percent of votes going to Merdon should be 50.
Then, I multiplied the expected percentages for both Merdon and Ulman by the total number of votes cast in the CE race, arriving at an expected total number of votes for each candidate in that precinct, or what I call the PPI. Crude, I know, but it’s what I got.
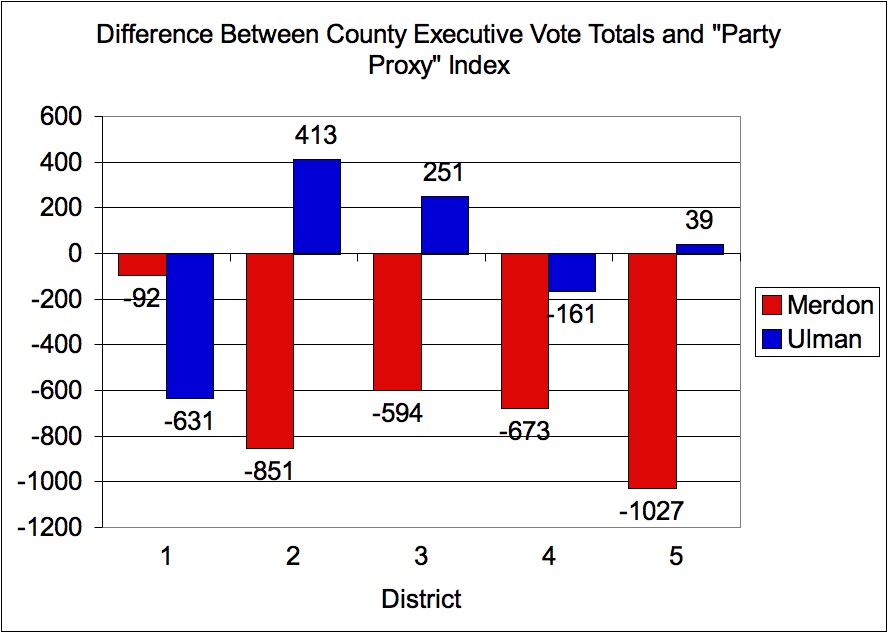
The differences between their actual total and the PPI (essentially, deficits or surpluses), aggregated by council district, are shown below.
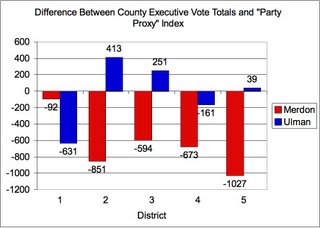
As you can see (and compare with the graph in yesterday’s post), Ulman did significantly worse in District 1 than his fellow Democrats. I can think of three reasons for this: Courtney Watson had a strong showing in several precincts, which skewed the index to an extent; this was Merdon’s council district and though it leans Democratic in registration, he managed to win here for years ago with well over 60 percent of the vote; and, as you’ll soon see, Wallis. To be sure, Comp Lite was likely a contributing factor to all three of these reasons, particularly with respect to Wallis. Overall, however, Ulman’s performance relative to expectations was fairly even.
Though Ulman had trouble in District 1, Merdon did, too. He failed to beat the Republican PPI in his own council district, something Wallis likely had a hand in. But the big surprise with Merdon, I think, are his performances in Districts 2 and 5, where combined he lost almost 2,000 votes relative to the average of his own party mates. Instead of guessing whether Wallis played a role in these discrepancies, let’s just go to the tape…
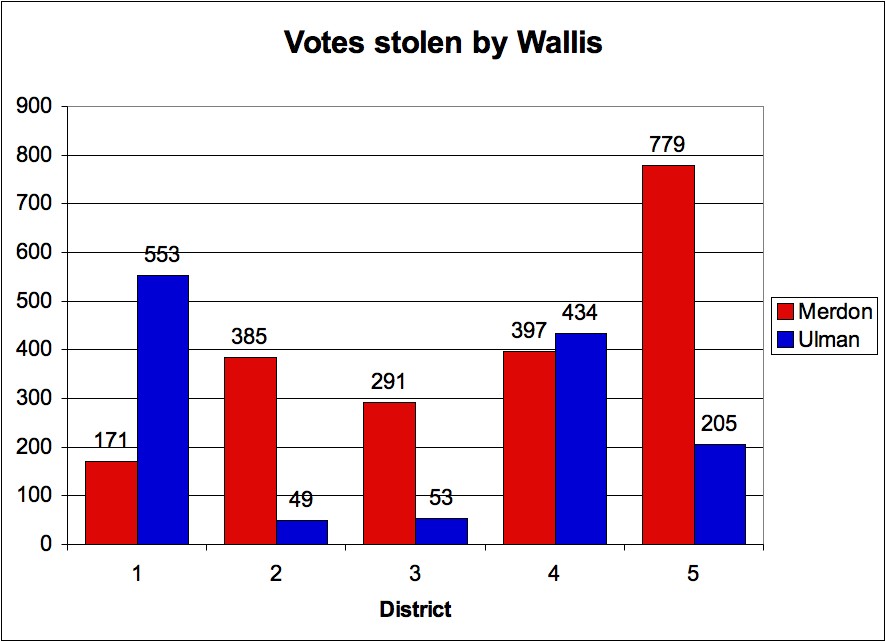
(Actually, before I show the graph, let me explain how I came up with a “Votes Stolen by Wallis” Variable. With the PPI, I had for each precinct a value showing how many votes CE candidates should or should not have gotten based on the performance of their party. For many precincts, there was a surplus for one and a deficit for the other, but these were never exact mirrors. So, I examined the unaccounted for votes [those not explained by the surpluses/deficits], compared them to Wallis’s totals, and arrived at a rough number of votes that I could reasonably expect as being votes that normally would have gone to a major party candidate in a two-person race. As I said, it’s crude.)
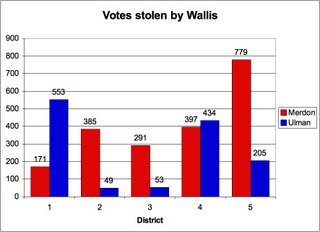
As you can see, Wallis took many votes from Ulman in District 1, thanks almost entirely to a few key precincts – for one, St. John’s Lane Elementary School, Wallis’s home district and the center of much of the Comp Lite backlash. Also, Wallis took a lot of votes from Ulman in District 4, but again, a few key precincts – his school, Harper’s Choice Middle, Harmony Hall and Longfellow Elementary – accounted for much of this.
Meanwhile, the main story of the graph has to be District 5, where Wallis nabbed almost 800 votes from Merdon. I’m still not sure what caused this, but a few people floated some ideas in the comments of yesterday’s post, including the incident at Cattail Creek Country Club and Merdon’s failure to endorse Greg Fox in the primary. I’m not sold on those explanations, however.
But, then, I don’t have any ideas of my own (yet), either.
In the end, however, with less than 5 percent of the total votes, Wallis didn’t alter the outcome of the election; even if all of his votes went to Merdon, it would not have been enough.
Feel free to share your thoughts below and expect more charts tomorrow (probably a closer look at District 1).
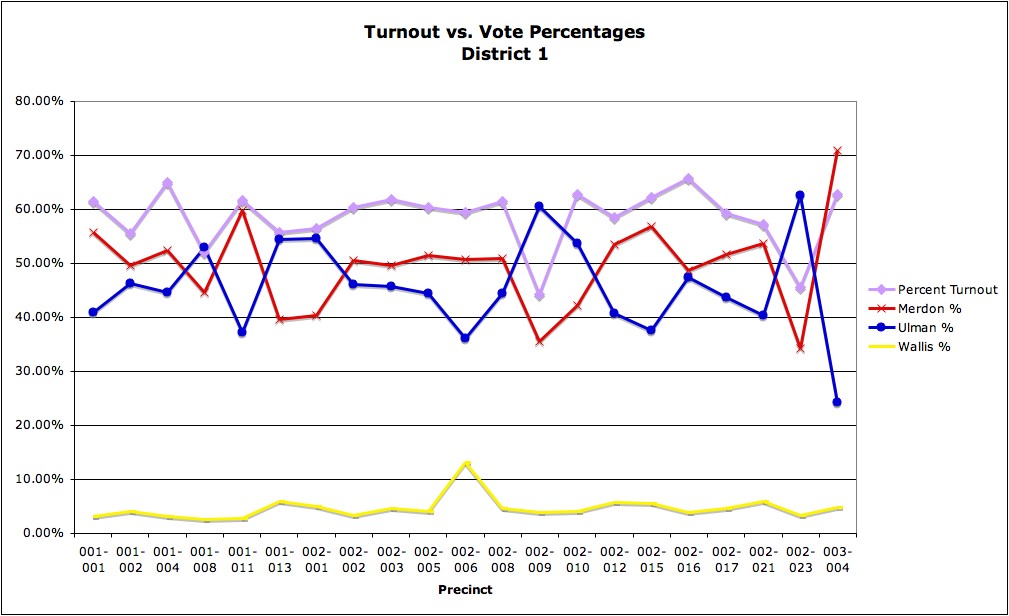
Bonus coverage: I not sure what this shows, but I ran a correlation calculation using the percentage of votes for each CE candidate and the percent turnout. Interestingly, there was a fairly strong correlation between high turnout and higher percentages for Merdon, with a weaker but still positive correlation between Wallis votes and turnout. Here’s a graph from District 1.
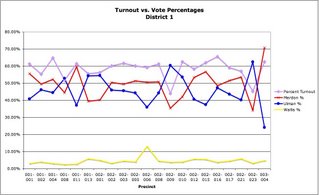
Notice how Merdon’s line tracks with turnout. Thoughts?